20 December 2021: Database Analysis
Identification of Feature Autophagy-Related Genes and DNA Methylation Profiles in Systemic Lupus Erythematosus Patients
Bo Gao ACE*DOI: 10.12659/MSM.933425
Med Sci Monit 2021; 27:e933425
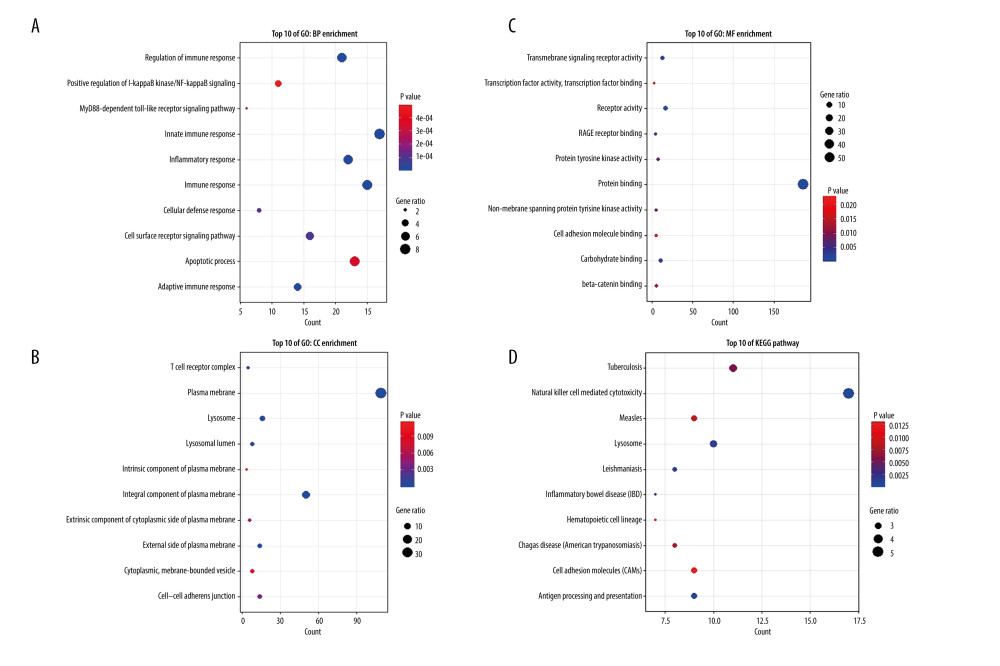
Figure 3 Top 10 GO analysis and KEGG pathway enrichment results for genes in red module. (A) The biological process group, (B) the cellular component group, (C) the molecular function group. (D) KEGG pathway enrichment result. The size of the bubble shows the gene ratios, while colors indicate the P value.