21 January 2023: Database Analysis
NFYAv1 is a Tumor-Promoting Transcript Associated with Poor Prognosis of Hepatocellular Carcinoma
Zigang Li1ABCDEF*, Chengshan You2ABDF, Jun Huang3CD, Ming Zhang1BEDOI: 10.12659/MSM.938410
Med Sci Monit 2023; 29:e938410


Abstract
BACKGROUND: Nuclear Transcription Factor Y Subunit Alpha (NFYA), together with NFYB and NFYC, form a sequence-specific heterotrimeric nuclear transcription factor (NFY), but their functional role in hepatocellular carcinoma (HCC) is still unclear. In this study, we explored the association between the NFY subunit genes and the survival of primary hepatocellular carcinoma (HCC) patients in The Cancer Genome Atlas (TCGA). The transcript-specific effect on HCC cell growth was studied.
MATERIAL AND METHODS: RNA-seq data from the Genotype-Tissue Expression Project (GTEx) and TCGA were analyzed in combination. In vitro cellular and molecular studies were conducted using SK-Hep-1 and Hep3B cells. Pearson’s correlation coefficients were calculated to assess correlations. Welch’s unpaired t test and one-way ANOVA with post hoc Tukey’s multiple comparisons were performed. Kaplan-Meier (K-M) survival curves were assessed by conducting log-rank (Mantel-Cox) test.
RESULTS: NFYA was the only prognosis-related gene. Among the 2 splicing transcripts of NFYA, the long isoform (NFYAv1, NM_002505.5) but not the short-form (NFYAv2, NM_021705.4) was significantly associated with worse progression-free survival (PFS) (high [n=179] vs low [n=179], HR: 1.657, 95% CI: 1.228-2.235, P<0.001) and disease-specific survival (DSS) (high [n=175] vs low [n=175], HR: 1.986, 95% CI: 1.269-3.108, P<0.001) in HCC patients. GO/KEGG analysis in TCGA confirmed that NFYAv1 and NFYAv2 co-expressed (|Pearson’s r|≥0.6) genes in primary HCC patients were enriched in quite different GO/KEGG terms. NFYAv1 knockdown significantly decreased cell viability and increased G0/G1 cell cycle arrest. The shRNA only targeting NFYAv1 had a significantly stronger growth-inhibiting effect than the shRNA targeting both NFYAv1 and NFYAv2.
CONCLUSIONS: This study showed that NFYAv1 is a tumor-promoting transcript associated with poor prognosis of HCC.
Keywords: Alternative Splicing, Liver Neoplasms, NFYA Protein, Human, Humans, Biomarkers, Tumor, Carcinoma, Hepatocellular, Gene Expression Regulation, Neoplastic, Prognosis, RNA, Small Interfering, CCAAT-Binding Factor
Background
Nuclear transcription factor Y subunit alpha (NFYA), together with NFYB and NFYC, form a sequence-specific heterotrimeric nuclear transcription factor (NFY), which is also known as CCAAT-binding factor (CBF) [1]. This factor specifically recognizes a 5′-CCAAT-3′ box motif in the promoters of its target genes. NFYA, the regulatory subunit of the trimer, contains a DNA-binding domain and is required for CCAAT binding [1]. The dysregulation of these subunit genes causes carcinogenesis and the development of multiple cancers [1,2]. NFYA upregulation was observed in lung adenocarcinoma [3], squamous cell carcinoma [4], head and neck squamous cell carcinoma [5], and cervical cancer [6] and was associated with the malignant behaviors of these tumors. Aberrantly expressed NFYB in colorectal cancer can induce the upregulation of E2F1 and the downstream checkpoint kinase 1 (CHK1), leading to acquired oxaliplatin resistance in colorectal cancer cells [7].
One recent study explored the expression profile of these 3 subunits genes in hepatocellular carcinoma based on data from TCGA and confirmed the upregulation of all these genes [8]. Available evidence showed that NFY factors are critical players in regulating cell proliferation and drug resistance of hepatocellular carcinoma (HCC) [9]. Zinc-fingers and homeoboxes 2 (ZHX2) can interact with NFYA and enhance its binding to the
NFYA has 2 splicing variants: a long-form (NFYAv1, NM_002505.5/ENST00000341376.11) and a short-form (NFYAv2, NM_021705.4/ENST00000353205.5). These 2 isoforms encode 2 different proteins. NFYAv1 has 347 amino acids, while NFYAv2 has 318 acids (missing 29 amino acids encoded by exon 3). These 2 isoforms showed different regulatory effects on cancer behaviors. NFYAv1, but not NFYAv2, promotes the malignant behavior of triple-negative breast cancer by enhancing lipogenesis [12]. A recent study showed that NFYAv2 could increase the expression of a gluconeogenic enzyme phosphoenolpyruvate carboxykinase 1 (PCK1), which subsequently induces high ROS generation and stimulate cell death of HCC cells [13]. However, the prognostic and functional differences between the 2 transcripts in HCC are still unclear.
In this study, we first explored the association between the NFY subunit genes and the survival of primary HCC patients in TCGA and found that only high
Material and Methods
GENE EXPRESSION AND SURVIVAL ANALYSIS USING ONLINE DATABASES:
RNA-seq data (gene and transcript expression) from Genotype-Tissue Expression Project (GTEx) and TCGA were analyzed in combination, using the platform provided by UCSC Xena Browser [14]. The data of 110 cases of normal liver tissues were extracted from GTEx. Only the primary HCC cases and corresponding adjacent normal tissues were extracted from TCGA-Liver Hepatocellular Carcinoma (LIHC). The cases of hepatocholangiocarcinoma and fibrolamellar carcinoma were removed. The survival data of the primary HCC cases were extracted for Kaplan-Meier (K-M) survival analysis, by median gene separation.
RETRIEVING ONLINE IMMUNOHISTOCHEMISTRY (IHC) DATA:
The expression of NFYA and MCM7 at the protein levels in normal liver and HCC tissues was assessed using IHC data from the Human Protein Atlas (https://www.proteinatlas.org/) [15].
GENE SET ENRICHMENT ANALYSIS (GSEA):
GSEA was performed to assess the difference in the hallmark gene sets (Molecular Signatures Database v7.4) between primary HCC patients with high and low NFYAv1 transcript (NM_002505.5) expression in TCGA, using the software provided by BROAD Institute [16]. The permutation number was set to 1000. The gene sets were considered statistically significant when normalized enrichment score (NES) >1, the nominal (NOM) P value ≤0.05, and FDR q value ≤0.25.
GENE ONTOLOGY (GO) AND KYOTO ENCYCLOPEDIA OF GENES AND GENOMES (KEGG) ENRICHMENT ANALYSIS:
NFYAv1- and NFYAv2-correlated genes in primary HCC cases in TCGA-LIHC were identified by setting |Pearson’s r ≥0.6| as the cutoff. Then, the genes were subjected to GO and KEGG analysis to identify the pathway terms enriched. Analysis was performed using an R package “clusterProfiler” [17]. Only the terms/pathways with a false discovery rate (FDR) <0.05 and q value (corrected P value) ≤0.05 were considered significantly enriched.
CELL CULTURE AND TRREATMENT:
HCC cell lines (SK-Hep-1 and Hep3B) were purchased from Procell (Wuhan, China). Cells were cultured following the recommended conditions according to the providers. Cells were grown in a humidified incubator with 5% CO2 at 37°C. To knockdown NYFA, lentivirus (pLKO.1-puro) carrying NFYA shRNA sequences were generated (shNFYA#1, 5′-TGGTGTCACTGCTGTGCAGTT-3′, shNFYA#2, 5′-CGAGCTAAACTAGAGGCAGAA-3′, and shNFYA#3, 5′-CCATCGTCTATCAACCAGTTA-3′). The scramble sequence (scr.) (5′-CAACAAGATGAAGAGCACCAA-3′) that does not target any gene served as the negative control. Among the 3 shRNAs, shNFYA#1 only targets NFYAv1, while the rest target both NFYAv1 and NFYAv2. Lentiviruses were produced by co-transfecting the lentiviral particles and packaging plasmids (psPAX2 and pMD2.G) into the HEK293T cells, following protocols described previously [18]. Transfection was performed using Lipofectamine 3000 Reagent (Thermo Fisher Scientific, Waltham, MA, USA). The viral supernatant was collected 48 h after transfection, filtered through a 0.45-μm filter, and stored at −80°C before further use. SK-Hep-1 and Hep3B cells were infected with lentivirus at a multiplicity of infection (MOI) of 10.
QUANTITATIVE REVERSE TRANSCRIPTION PCR (RT-QPCR):
Total RNA was extracted from cell samples using TRIzol (Thermo Fisher Scientific) and then reversely transcribed into cDNA using a High-Capacity cDNA Reverse Transcription Kit (Thermo Fisher Scientific). RT-qPCR was performed using Power SYBR Green PCR Master Mix (Bio-Rad, Hercules, CA, USA) with a Bio-Rad CFX96 Touch Real-Time PCR Detection System. The following primers validated by OriGene (
WESTERN BLOTTING:
Total proteins from cells were extracted using ice-cold RIPA lysis buffer (Beyotime, Shanghai, China) according to the manufacturer’s instructions. Then, the protein concentration was measured using a BCA Kit (P0012, Beyotime, Shanghai, China). Proteins (30 μg) were separated by 10% SDS-PAGE and then transferred onto polyvinylidene fluoride (PVDF) membranes. The membranes were incubated overnight at 4°C with antibodies against NFYA (1: 2000, ab264275, Abcam, Cambridge, UK) and β-actin (1: 2000, 20536-1-AP, Proteintech, Wuhan, China). Then, the membranes were washed with Tris-buffered saline with 0.1% Tween 20 and incubated with HRP-conjugated IgG at room temperature for 1 h. Protein band signals were developed using an ECL substrate (Millipore, Billerica, MA, USA).
FLOW CYTOMETRIC ANALYSIS OF CELL CYCLE:
Cell cycle distribution was performed by PI staining. In brief, cells were harvested, washed in PBS, and fixed in cold 70% ethanol for 30 min at 4°C. Then, cells were washed in PBS and treated with ribonuclease. Then, cells were incubated with PI solution (200 μl from 50 μg/ml stock solution) for 30 min at 4°C. Then, PI staining was detected on a NovoCyte flow cytometer (Agilent, Santa Clara, CA, USA) and analyzed using NovoExpress software (Agilent).
STATISTICAL ANALYSIS:
All statistical analyses were performed with GraphPad Prism 8.1, using data obtained from at least 3 independent experiments. Data are presented as the mean and standard deviation (SD). Correlation analysis was performed by calculating Pearson’s correlation coefficient (r value). Welch’s unpaired
Results
HCC PATIENTS WITH ELEVATED NFYA EXPRESSION HAD SIGNIFICANTLY WORSE SURVIVAL:
Since all NFY subunit genes are upregulated in HCC tissues compared to adjacent normal tissues [8], we assessed their correlation with the survival of patients with primary HCC in TCGA by generating K-M survival curves. The differences in DSS and PFS were compared between patients with the higher 50% and lower 50% of gene expression. Log-rank test results indicated that only the group with the top 50% of NFYA expression, but not NFYB or NFYC, had significantly shorter DSS (P=0.014) and PFS (P=0.042) compared to the respective lower 50% gene expression controls (Figure 1A–F). IHC staining of both normal liver and HCC tissues revealed that NFYA protein expression is rather low in normal liver tissue, mainly in the cholangiocytes (Figure 1G, left panel). In comparison, HCC tissues usually had medium NFYA expression in the nucleus (Figure 1G, right panel).
NFYAV1, BUT NOT NFYAV2, IS ASSOCIATED WITH POOR PROGNOSIS IN PATIENTS WITH HCC:
Since the 2 isoforms of NFYA might have distinct regulatory effects on cancer cells, we checked their expression composition and relative expression. Isoform percentage analysis indicated that NFYAv1 is the dominant isoform in both normal liver and HCC tissues, with a median isoform percentage higher than 80% (Figure 2A). Expression analysis confirmed that both transcripts were significantly upregulated in HCC tissues (Figure 2B). K-M survival analysis showed that high NFYAv1 expression (Figure 2D, 2F), but not NFYAv2 expression (Figure 2C, 2E), was associated with significantly worse PFS (HR: 1.657, 95% CI: 1.228–2.235, P<0.001) and DSS (HR: 1.986, 95% CI: 1.269–3.108, P<0.001). These findings suggest that these 2 isoforms have distinct regulatory effects on HCC.
GO/KEGG ANALYSIS IDENTIFIED DISTINCT ENRICHMENTS OF NFYAV1 AND NFYAV2 CO-EXPRESSED GENES:
To explore the potential functional differences between NFYAv1 and NFYAv2, we identified their correlated genes in primary HCC patients in TCGA separately. Only the genes strongly co-expressed (|Pearson’s r| ≥0.6) with each transcript were extracted. Then, their enrichment in the GO/KEGG pathways was analyzed. Results showed that 61 genes were co-expressed with NFYAv1, while 495 genes were co-expressed with NFYAv2 in primary HCC patients in TCGA (Figure 3A). Among these genes, only 16 genes are in the overlap set (Figure 3A). GO/KEGG analysis showed that only histone bindings were the common GO term in the Molecular Function (MF) (Figure 3B, 3C, Tables 1, 2). These findings suggest these NFYAv1 and NFYAv2 regulate different signaling pathways in HCC.
KNOCKDOWN OF NFYAV1 IMPAIRED HCC CELL GROWTH AND CELL CYCLE PROGRESSION:
To explore the association between NFYAv1 expression and the malignant behaviors of HCC tumors, we performed GSEA to assess differences in gene set enrichment between patients with higher 50% and lower 50% of NFYAv1 expression within the HALLMARK GENESET (Figure 4A). Only the gene sets with NOM P<0.05 and FDR q<0.25 were included. Results showed that the high NFYAv1 expression group had increased gene expression enriched in the mitotic spindle and G2/M checkpoint gene sets (Figure 4A, 4B). These findings suggest that NFYAv1can regulate the cell cycle progression of HCC cells.
Then, we generated lentiviral shRNA targeting exon 3 of NFYAv1 (shNFYA#1) and the other 2 shRNAs targeting both NFYAv1 and NFYAv2. SK-Hep-1 and Hep3B were infected with the lentiviral shNFYA particles for knockdown (Figure 4C). At 48 h after lentiviral infection, the cells were lysed and subjected to qRT-PCR (Figure 4C, upper panel) and western blot assays (Figure 4C, bottom panel). shNFYA#1 could specifically knockdown NFYAv1 at the mRNA and protein levels, while shNFYA#2 and shNFYA#3 suppressed the expression of both NFYAv1 and NFYAv2 (Figure 4C). CCK-8 assays indicated that SK-Hep-1 and Hep3B cells with NFYA knockdown had significantly lower viability than the scramble control (scr.) group (Figure 4D, 4E). Noticeably, shNFYA#1 showed a more substantial growth-inhibiting effect than shNFYA#3 (Figure 4D, 4E). By performing flow cytometric analysis of the cell cycle using both SK-Hep-1 and Hep3B cells, we found that NFYA knockdown significantly increased the ratio of cells in G0/G1 phases and reduced the cells in S and G2/M phases (Figure 4G, 4H). These data suggest that both shNFYA#1 and shNFYA#3 induced cell cycle arrest at the G1/S phase and inhibited G2/M transition.
Discussion
Bioinformatic analysis based on RNA-seq and survival data from TCGA revealed that elevated
Our GO/KEGG analysis confirmed that NFYAv1 and NFYAv2 co-expressed genes are enriched in different GO/KEGG terms. GSEA assay indicated that the high NFYAv1 expression group had increased expression of genes enriched in the mitotic spindle and G2/M checkpoint gene sets, which is closely related to tumor cell proliferation. To validate this regulation, we further designed NFYAv1-specific shRNA and conducted CCK-8 assays and cell cycle analysis. Our findings imply that NFYAv1 knockdown significantly decreased cell viability and increased G0/G1 cell cycle arrest. In addition, we observed that the shRNA targeting NFYAv1 had a significantly stronger growth-inhibiting effect than shRNA targeting both NFYAv1 and NFYAv2. This difference might be explained by a compensation associated with NFYAv2 knockdown, since it might be a tumor-suppressive transcript in HCC [13]. These findings are consistent with a previous review concluding that NFYA binds to and regulates the transcription of a series of cell cycle-related genes, thereby playing a fundamental role in cell proliferation [1].
Since NFYB and NFYC subunits are mainly ubiquitously expressed and NFYA is a DNA-binding subunit, NFYA might be a limiting subunit of the transcription trimer [1]. Available evidence shows that the transcriptional activating effects of the NFY complex are tissue- and cell-dependent [22–24]. In HCC, only several downstream targets of the NFY complex were validated, including
This study also has some limitations. Firstly, the downstream regulation of NFYAv1 in HCC was not explored. Transcription factor regulation mainly relies on the downstream effectors. To further understand the functional role of NFYA in HCC, the isoform-specific downstream targets need to be explored. Secondly, only preliminary in vitro studies were conducted to validate the functional role of NFYAv1. Future in vivo studies should be conducted to understand the details of molecular regulations.
Conclusions
In summary, this study revealed that among the 2 NFYA splicing transcripts, only NFYAv1 is a tumor-promoting transcript associated with poor prognosis of HCC.
Figures
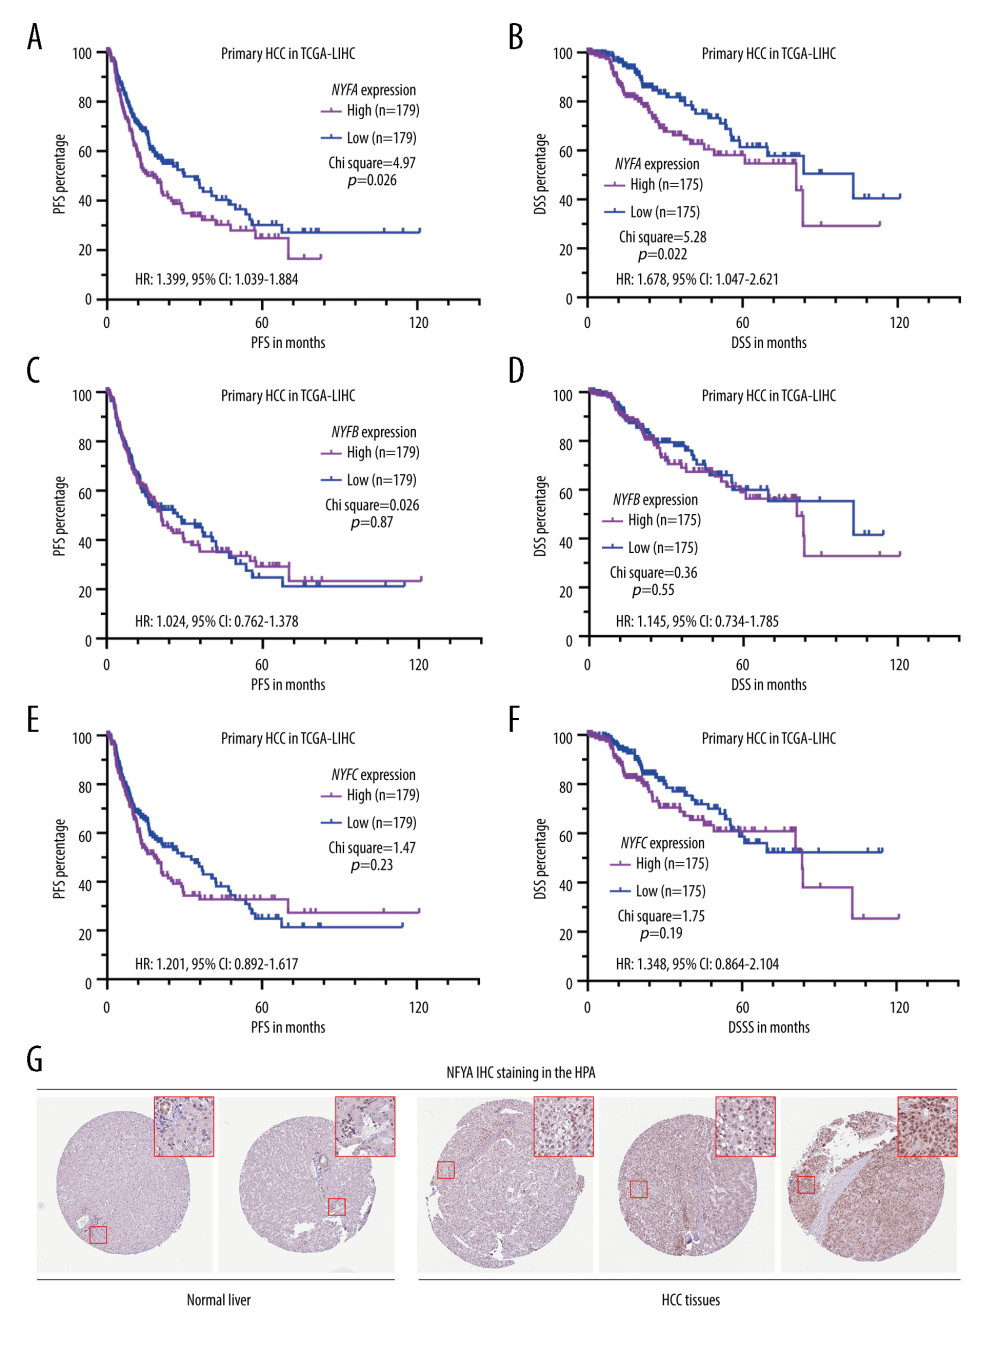 Figure 1. HCC patients with elevated NFYA expression had significantly worse survival(A–F) K-M analysis for DSS (B, D, F) and PFS (A, C, E) comparison was performed. Patients with primary HCC in TCGA were classified into 2 groups by the median NFYA (A, B), NFYB (C, D) or NFYC (E, F) expression. (G) NFYA protein expression in normal liver and HCC tissues. IHC staining images were obtained from the HPA, from the following links: https://www.proteinatlas.org/ENSG00000001167-NFYA/tissue/liver and https://www.proteinatlas.org/ENSG00000001167-NFYA/pathology/liver+cancer#ihc.
 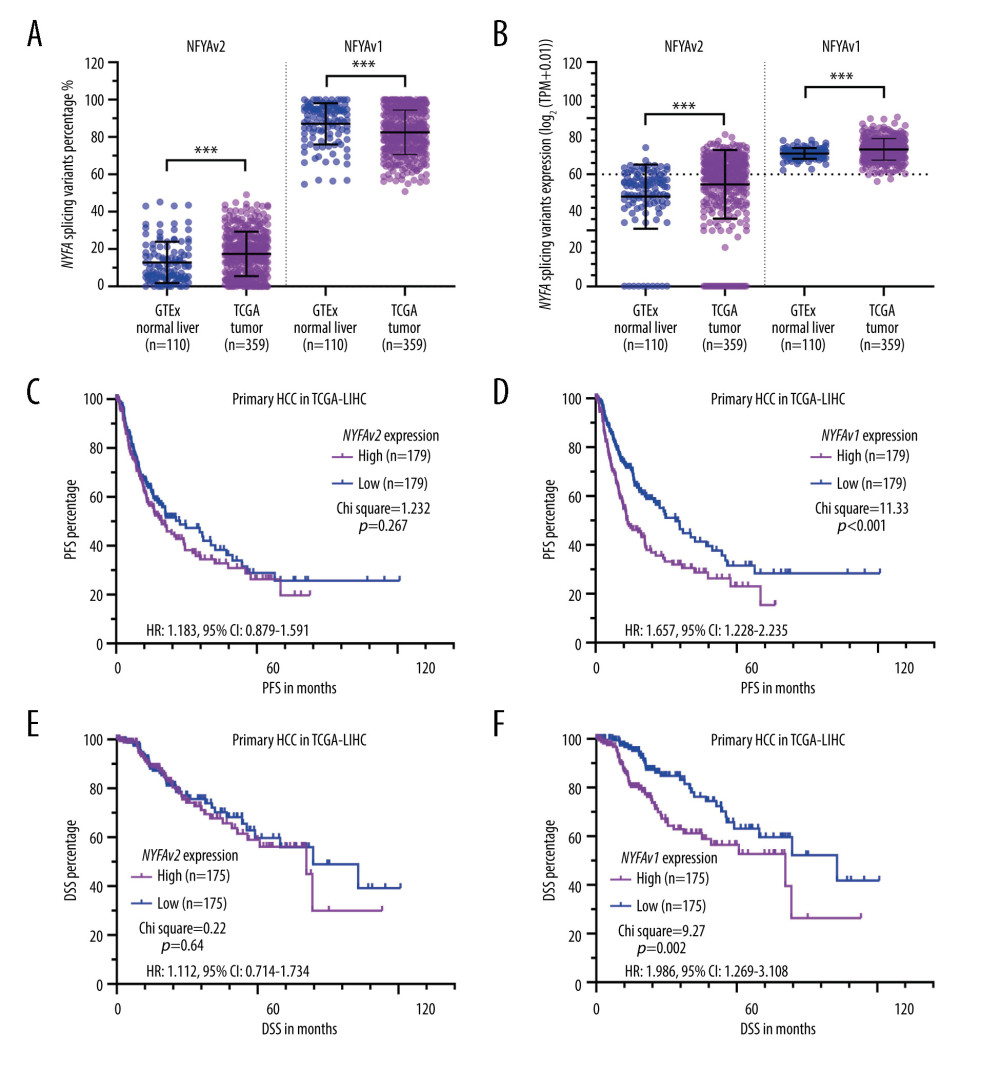 Figure 2. NFYAv1, but not NFYAv2, is associated with poor prognosis in patients with HCC(A, B) Comparison of NFYAv1 and NFYAv2 isoform expression percentage (A) and relative expression (B) in normal liver tissues in GTEx (n=110) and HCC tissues in TCGA (n=359). (C–F) K-M analysis for PFS (C, D) and DSS (E, F) comparison was performed. Patients with primary HCC in TCGA were classified into 2 groups by the median NFYAv2 (C, E) or NFYAv1 (D, F) expression. The log-rank test was performed to evaluate the survival difference. ***, P<0.001.
 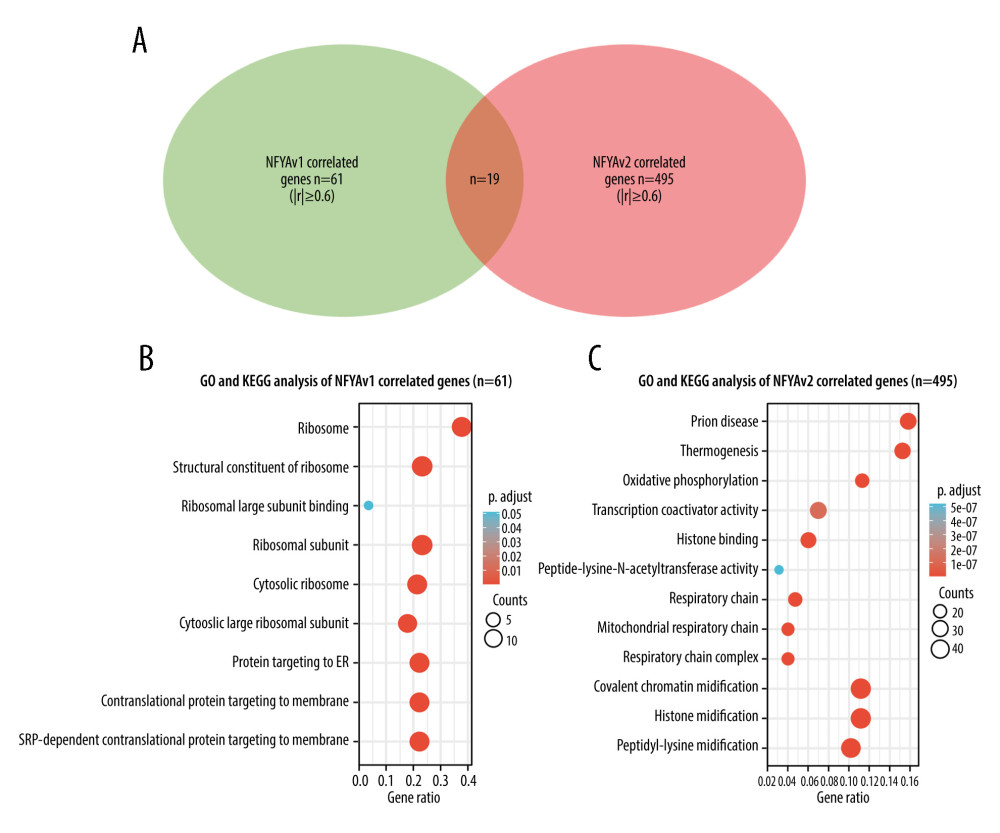 Figure 3. GO/KEGG analysis identified distinct pathways of NFYAv1 and NFYAv2 co-expressed genes(A) A Venn diagram showing the common and unique genes highly correlated (|Pearson’s r≥0.6|) with NFYAv1 and NFYAv2 expression in primary HCC cases in TCGA. (B, C) Bubble plots were generated to show the top enriched terms in GO/KEGG pathway enrichment analysis of genes highly correlated (|Pearson’s r≥0.6|) with NFYAv1 (B) and NFYAv2 (C) expression. P values are represented by colors, while gene counts are represented by bubble size.
 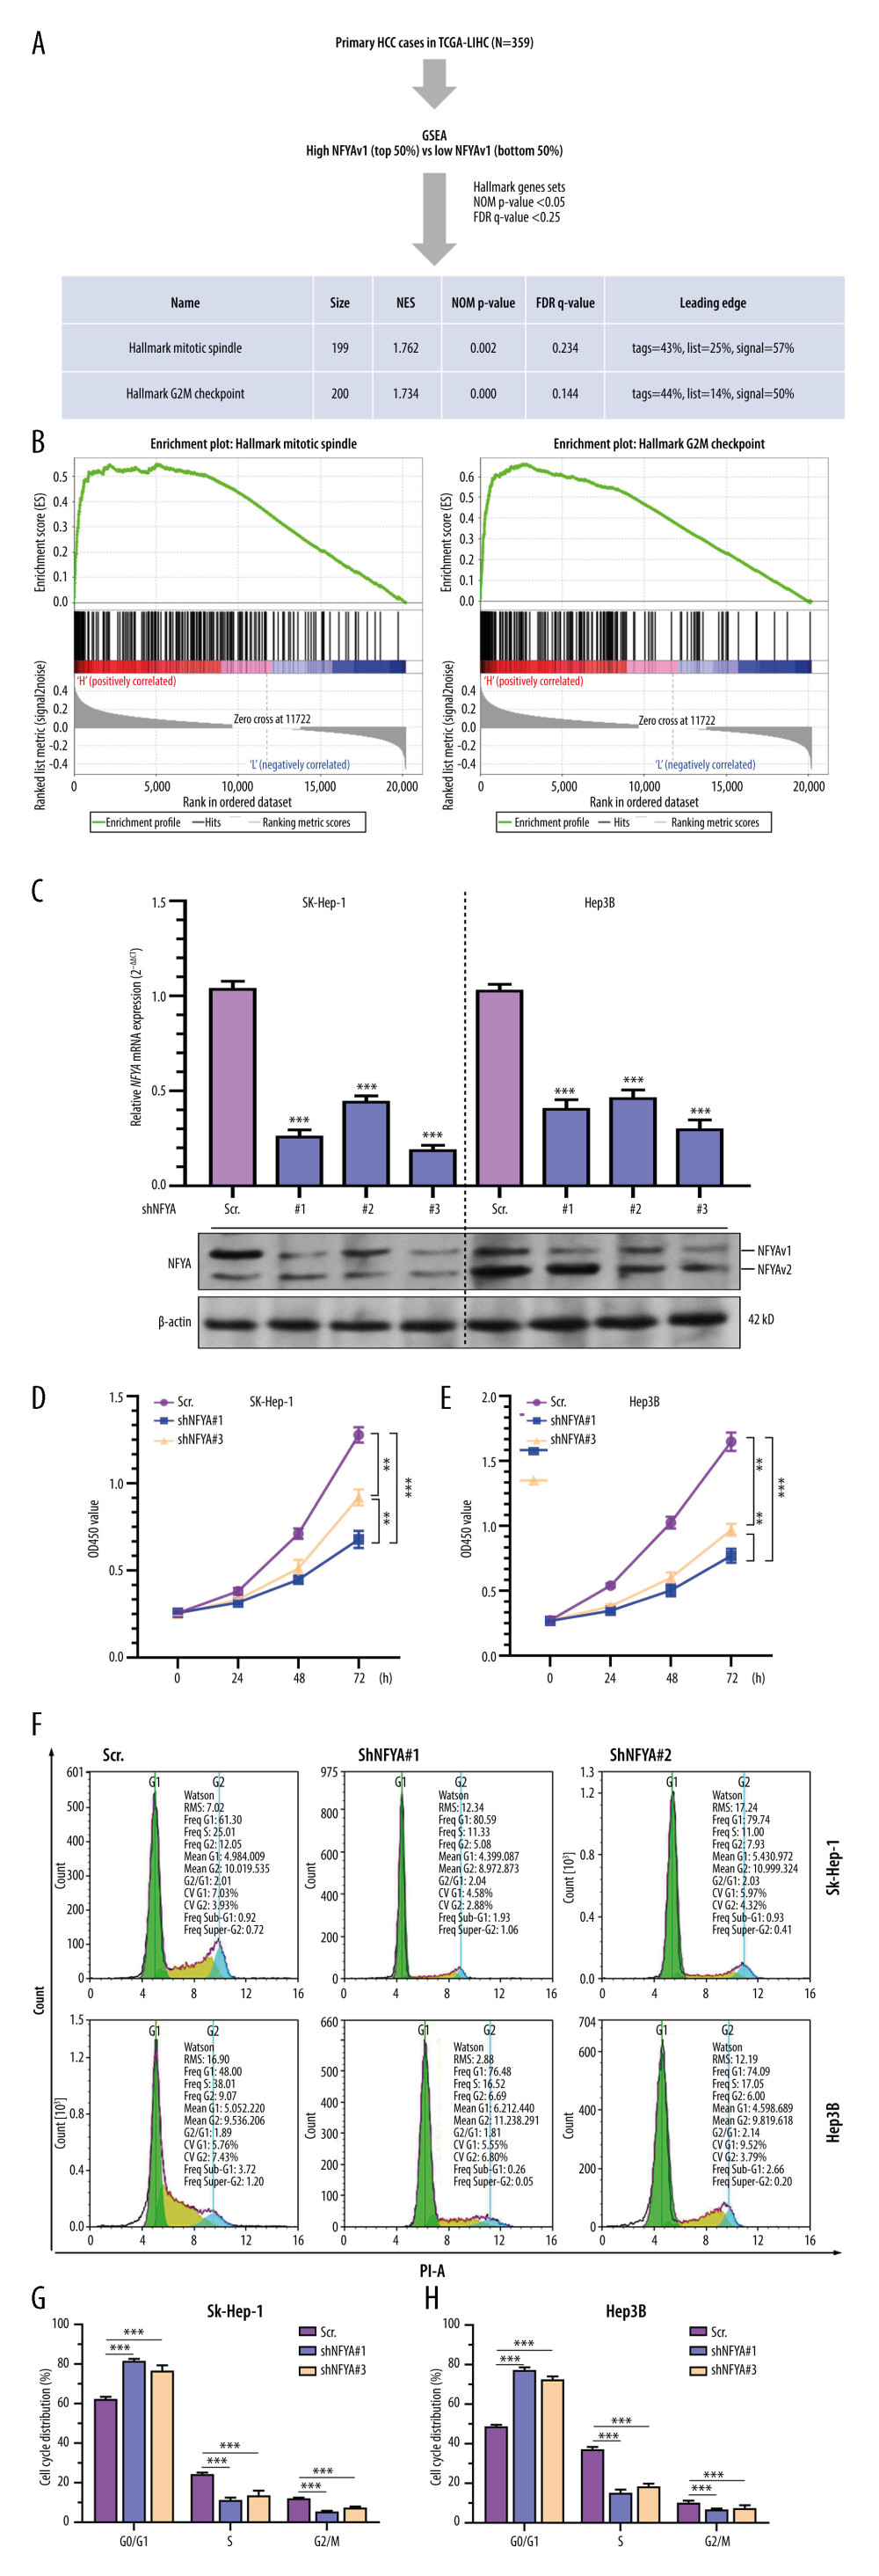 Figure 4. Knockdown of NFYAv1 impaired HCC cell growth and cell cycle progression(A) A schematic chart showing the strategy used to perform single-gene GSEA and a summary of the gene sets associated with high NFYAv1 expression. (B) GSEA plots showing the graphical view of the enrichment score for the mitotic spindle and G2/M checkpoint gene sets associated with high NFYAv1 expression. (C) RT-qPCR (upper panel) and western blot (bottom panel) assays were performed to detect the expression of NFYA at the mRNA and protein levels in SK-Hep-1 and Hep3B cells 48 h after infection with lentiviral shNFYA. (D, E) CCK-8 assays were conducted to measure the viability of SK-Hep-1 and Hep3B cells with or without NFYA knockdown. (F–H) Cell cycle analysis was performed through PI staining and following flow cytometry for SK-Hep-1 (F upper panel and G) and Hep3B (F bottom panel and G) cells after lentiviral shNFYA infection. Quantitative measurements (F, G) of the cell cycle phase were conducted. Data are mean±SD (n=3) of 3 biological repeats. **, P<0.01; ***, P<0.001.
 References
1. Gurtner A, Manni I, Piaggio G, NF-Y in cancer: Impact on cell transformation of a gene essential for proliferation: Biochim Biophys Acta Gene Regul Mech, 2017; 1860(5); 604-16
2. Benatti P, Chiaramonte ML, Lorenzo M, NF-Y activates genes of metabolic pathways altered in cancer cells: Oncotarget, 2016; 7(2); 1633-50
3. Bezzecchi E, Ronzio M, Semeghini V, NF-YA overexpression in lung cancer: LUAD: Genes (Basel), 2020; 11(2); 198
4. Bezzecchi E, Ronzio M, Dolfini D, Mantovani R, NF-YA overexpression in lung cancer: LUSC: Genes (Basel), 2019; 10(11); 937
5. Bezzecchi E, Bernardini A, Ronzio M, NF-Y subunits overexpression in HNSCC: Cancers (Basel), 2021; 13(12); 2019
6. Yang WT, Zhao ZX, Li B, Zheng PS, NF-YA transcriptionally activates the expression of SOX2 in cervical cancer stem cells: PLoS One, 2019; 14(7); e0215494
7. Fang Z, Gong C, Yu S, NFYB-induced high expression of E2F1 contributes to oxaliplatin resistance in colorectal cancer via the enhancement of CHK1 signaling: Cancer Lett, 2018; 415; 58-72
8. Bezzecchi E, Ronzio M, Mantovani R, Dolfini D, NF-Y overexpression in liver hepatocellular carcinoma (HCC): Int J Mol Sci, 2020; 21(23); 9157
9. Goeman F, Manni I, Artuso S, Molecular imaging of nuclear factor-Y transcriptional activity maps proliferation sites in live animals: Mol Biol Cell, 2012; 23(8); 1467-74
10. Ma H, Yue X, Gao L, ZHX2 enhances the cytotoxicity of chemotherapeutic drugs in liver tumor cells by repressing MDR1 via interfering with NF-YA: Oncotarget, 2015; 6(2); 1049-63
11. Su B, Luo T, Zhu J, Interleukin-1beta/Iinterleukin-1 receptor-associated kinase 1 inflammatory signaling contributes to persistent Gankyrin activation during hepatocarcinogenesis: Hepatology, 2015; 61(2); 585-97
12. Okada N, Ueki C, Shimazaki M, NFYA promotes the malignant behavior of triple-negative breast cancer through the regulation of lipid metabolism: bioRxiv, 2022; 2022; 493660
13. Tsujimoto G, Ito R, Yoshikawa K, NFYA promotes the anti-tumor effects of gluconeogenesis in hepatocellular carcinoma through the regulation of PCK1 expression: Front Cell Dev Biol, 2022; 10; 983599
14. Goldman MJ, Craft B, Hastie M, Visualizing and interpreting cancer genomics data via the Xena platform: Nat Biotechnol, 2020; 38(6); 675-78
15. Lindskog C, The potential clinical impact of the tissue-based map of the human proteome: Expert Rev Proteomics, 2015; 12(3); 213-15
16. Subramanian A, Tamayo P, Mootha VK, Gene set enrichment analysis: A knowledge-based approach for interpreting genome-wide expression profiles: Proc Natl Acad Sci USA, 2005; 102(43); 15545-50
17. Yu G, Wang LG, Han Y, He QY, clusterProfiler: An R package for comparing biological themes among gene clusters: OMICS, 2012; 16(5); 284-87
18. Elegheert J, Behiels E, Bishop B, Lentiviral transduction of mammalian cells for fast, scalable and high-level production of soluble and membrane proteins: Nat Protoc, 2018; 13(12); 2991-3017
19. Bernardini A, Gallo A, Gnesutta N, Dolfini D, Mantovani R, Phylogeny of NF-YA trans-activation splicing isoforms in vertebrate evolution: Genomics, 2022; 114(4); 110390
20. Dolfini D, Andrioletti V, Mantovani R, Overexpression and alternative splicing of NF-YA in breast cancer: Sci Rep, 2019; 9(1); 12955
21. Belluti S, Semeghini V, Rigillo G, Alternative splicing of NF-YA promotes prostate cancer aggressiveness and represents a new molecular marker for clinical stratification of patients: J Exp Clin Cancer Res, 2021; 40(1); 362
22. Han F, Zhang L, Liao S, The interaction between S100A2 and KPNA2 mediates NFYA nuclear import and is a novel therapeutic target for colorectal cancer metastasis: Oncogene, 2022; 41(5); 657-70
23. Poluri RTK, Paquette V, Allain EP, KLF5 and NFYA factors as novel regulators of prostate cancer cell metabolism: Endocr Relat Cancer, 2021; 28(4); 257-71
24. Lee MG, Pedersen PL, Glucose metabolism in cancer: importance of transcription factor-DNA interactions within a short segment of the proximal region og the type II hexokinase promoter: J Biol Chem, 2003; 278(42); 41047-58
25. Guo W, Hu Z, Bao Y, A LIN28B Tumor-Specific Transcript in Cancer: Cell Rep, 2018; 22(8); 2016-25
26. Sakurai T, Yada N, Hagiwara S, Gankyrin induces STAT3 activation in tumor microenvironment and sorafenib resistance in hepatocellular carcinoma: Cancer Sci, 2017; 108(10); 1996-2003
27. Han J, Wang F, Lan Y, KIFC1 regulated by miR-532-3p promotes epithelial-to-mesenchymal transition and metastasis of hepatocellular carcinoma via gankyrin/AKT signaling: Oncogene, 2019; 38(3); 406-20
28. Liu R, Li Y, Tian L, Gankyrin drives metabolic reprogramming to promote tumorigenesis, metastasis and drug resistance through activating beta-catenin/c-Myc signaling in human hepatocellular carcinoma: Cancer Lett, 2019; 443; 34-46
Figures
Figure 1. HCC patients with elevated NFYA expression had significantly worse survival(A–F) K-M analysis for DSS (B, D, F) and PFS (A, C, E) comparison was performed. Patients with primary HCC in TCGA were classified into 2 groups by the median NFYA (A, B), NFYB (C, D) or NFYC (E, F) expression. (G) NFYA protein expression in normal liver and HCC tissues. IHC staining images were obtained from the HPA, from the following links: https://www.proteinatlas.org/ENSG00000001167-NFYA/tissue/liver and https://www.proteinatlas.org/ENSG00000001167-NFYA/pathology/liver+cancer#ihc.Figure 2. NFYAv1, but not NFYAv2, is associated with poor prognosis in patients with HCC(A, B) Comparison of NFYAv1 and NFYAv2 isoform expression percentage (A) and relative expression (B) in normal liver tissues in GTEx (n=110) and HCC tissues in TCGA (n=359). (C–F) K-M analysis for PFS (C, D) and DSS (E, F) comparison was performed. Patients with primary HCC in TCGA were classified into 2 groups by the median NFYAv2 (C, E) or NFYAv1 (D, F) expression. The log-rank test was performed to evaluate the survival difference. ***, P<0.001.Figure 3. GO/KEGG analysis identified distinct pathways of NFYAv1 and NFYAv2 co-expressed genes(A) A Venn diagram showing the common and unique genes highly correlated (|Pearson’s r≥0.6|) with NFYAv1 and NFYAv2 expression in primary HCC cases in TCGA. (B, C) Bubble plots were generated to show the top enriched terms in GO/KEGG pathway enrichment analysis of genes highly correlated (|Pearson’s r≥0.6|) with NFYAv1 (B) and NFYAv2 (C) expression. P values are represented by colors, while gene counts are represented by bubble size.Figure 4. Knockdown of NFYAv1 impaired HCC cell growth and cell cycle progression(A) A schematic chart showing the strategy used to perform single-gene GSEA and a summary of the gene sets associated with high NFYAv1 expression. (B) GSEA plots showing the graphical view of the enrichment score for the mitotic spindle and G2/M checkpoint gene sets associated with high NFYAv1 expression. (C) RT-qPCR (upper panel) and western blot (bottom panel) assays were performed to detect the expression of NFYA at the mRNA and protein levels in SK-Hep-1 and Hep3B cells 48 h after infection with lentiviral shNFYA. (D, E) CCK-8 assays were conducted to measure the viability of SK-Hep-1 and Hep3B cells with or without NFYA knockdown. (F–H) Cell cycle analysis was performed through PI staining and following flow cytometry for SK-Hep-1 (F upper panel and G) and Hep3B (F bottom panel and G) cells after lentiviral shNFYA infection. Quantitative measurements (F, G) of the cell cycle phase were conducted. Data are mean±SD (n=3) of 3 biological repeats. **, P<0.01; ***, P<0.001. Tables
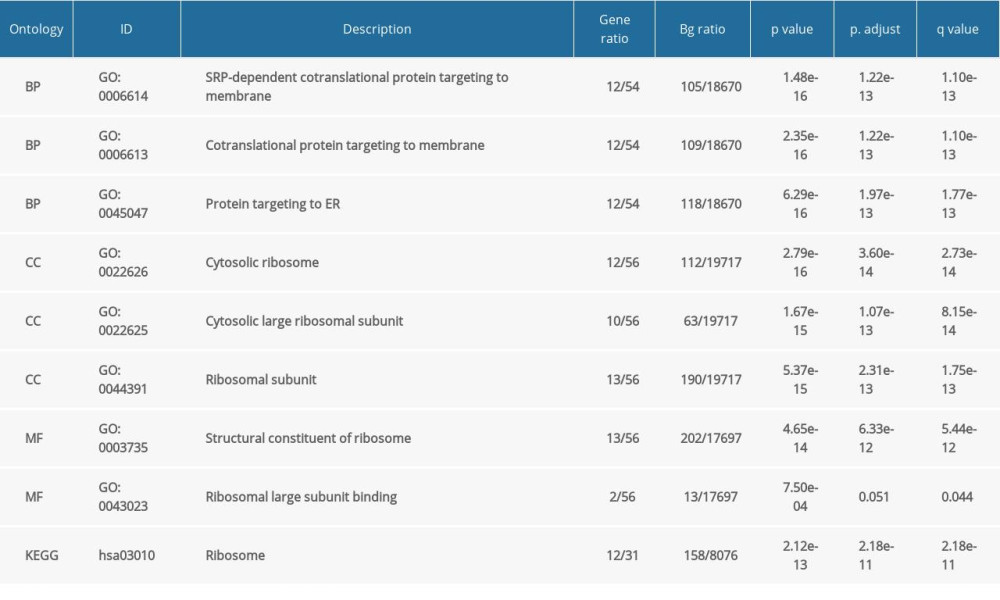 Table 1. GO and KEGG analysis of NFYAv1-correlated genes in HCC cases in TCGA-LIHC.
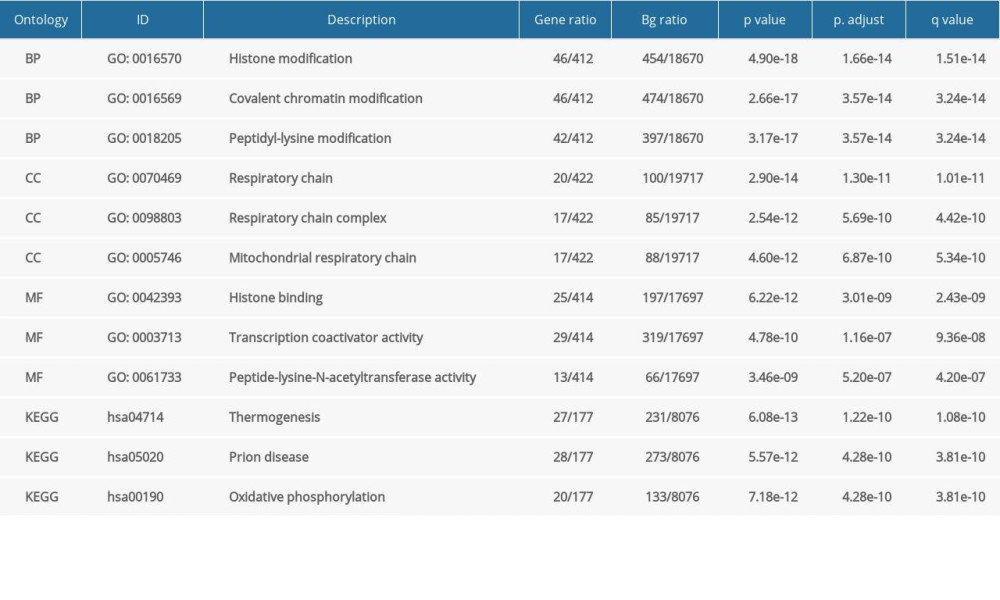 Table 2. GO and KEGG analysis of NFYAv2-correlated genes in HCC cases in TCGA-LIHC.Table 1. GO and KEGG analysis of NFYAv1-correlated genes in HCC cases in TCGA-LIHC.Table 2. GO and KEGG analysis of NFYAv2-correlated genes in HCC cases in TCGA-LIHC.
 In Press
21 Mar 2024 : Meta-Analysis
Economic Evaluation of COVID-19 Screening Tests and Surveillance Strategies in Low-Income, Middle-Income, a...Med Sci Monit In Press; DOI: 10.12659/MSM.943863
10 Apr 2024 : Clinical Research
Predicting Acute Cardiovascular Complications in COVID-19: Insights from a Specialized Cardiac Referral Dep...Med Sci Monit In Press; DOI: 10.12659/MSM.942612
06 Mar 2024 : Clinical Research
Enhanced Surgical Outcomes of Popliteal Cyst Excision: A Retrospective Study Comparing Arthroscopic Debride...Med Sci Monit In Press; DOI: 10.12659/MSM.941102
06 Mar 2024 : Clinical Research
Prevalence and Variation of Medical Comorbidities in Oral Surgery Patients: A Retrospective Study at Jazan ...Med Sci Monit In Press; DOI: 10.12659/MSM.943884
Most Viewed Current Articles
17 Jan 2024 : Review article
Vaccination Guidelines for Pregnant Women: Addressing COVID-19 and the Omicron VariantDOI :10.12659/MSM.942799
Med Sci Monit 2024; 30:e942799
14 Dec 2022 : Clinical Research
Prevalence and Variability of Allergen-Specific Immunoglobulin E in Patients with Elevated Tryptase LevelsDOI :10.12659/MSM.937990
Med Sci Monit 2022; 28:e937990
16 May 2023 : Clinical Research
Electrophysiological Testing for an Auditory Processing Disorder and Reading Performance in 54 School Stude...DOI :10.12659/MSM.940387
Med Sci Monit 2023; 29:e940387
01 Jan 2022 : Editorial
Editorial: Current Status of Oral Antiviral Drug Treatments for SARS-CoV-2 Infection in Non-Hospitalized Pa...DOI :10.12659/MSM.935952
Med Sci Monit 2022; 28:e935952