21 January 2022: Clinical Research
A Resting-State Functional Magnetic Resonance Imaging Study of Abnormal Frontoparietal Network Function in Migraine without Aura
Wen-Qiang Cui 1ABCDEF* , Si-Shuo Zhang 12BE* , Fei Xu 3BCE* , Hai-Tao Li 1BE , Hong-Wei Zhi 1BE , Ya-Han Wang 1CE , Yong-Jun Huo 4CE , Xiang-Qing Xu 1AEFG* , Hong-Yun Wu 1ACEG*DOI: 10.12659/MSM.934975
Med Sci Monit 2022; 28:e934975
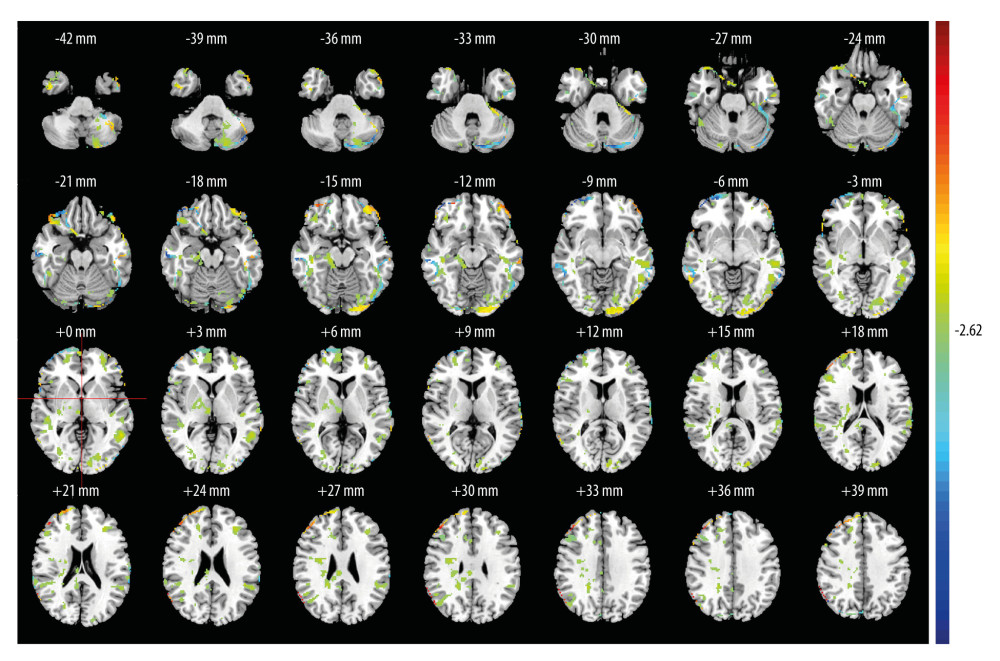
Figure 3 Comparison of lFPN functional activity between the MwoA group and the HC groupThe functional activity peak of the right inferior semilunar lobule [Coordinates (38, −72, 46), T-value (−18.60), Voxel values (2283)], left fusiform gyrus [Coordinates (−54, −56, −10), T-value (−15.55), Voxel values (463)], the orbital part of right inferior frontal gyrus [Coordinates (48, 44, −14), T-value (−14.86), Voxel values (302)], right parietal lobule [Coordinates (36, −68, 52), T-value (−14.70), Voxel values (377)] and left supra-marginal gyrus [Coordinates (−48, −62, 46), T-value (−14.47), Voxel values (733)] were weaker in the MwoA group. The functional activity peak of the left orbital middle frontal gyrus [Coordinates (−38, 42, −14), T-value (18.30), Voxel values (2469)] and right middle frontal gyrus [Coordinates (54, 34, 22), T-value (9.06), Voxel values (291)] were higher in the MwoA group. The warmer colors represent a stronger functional activity, while the cold colors represent a weakened functional activity. MATLAB R2017a (MathWorks, Inc., USA) was used to create this figure.