15 May 2022: Database Analysis
Bibliometric Visualization Analysis of Microbiome-Gut-Brain Axis from 2004 to 2020
Hui Wang 12* , Tianlin Long 22* , Jing You 22 , Ping Li 232* , Quanhua Xu 22*DOI: 10.12659/MSM.936037
Med Sci Monit 2022; 28:e936037
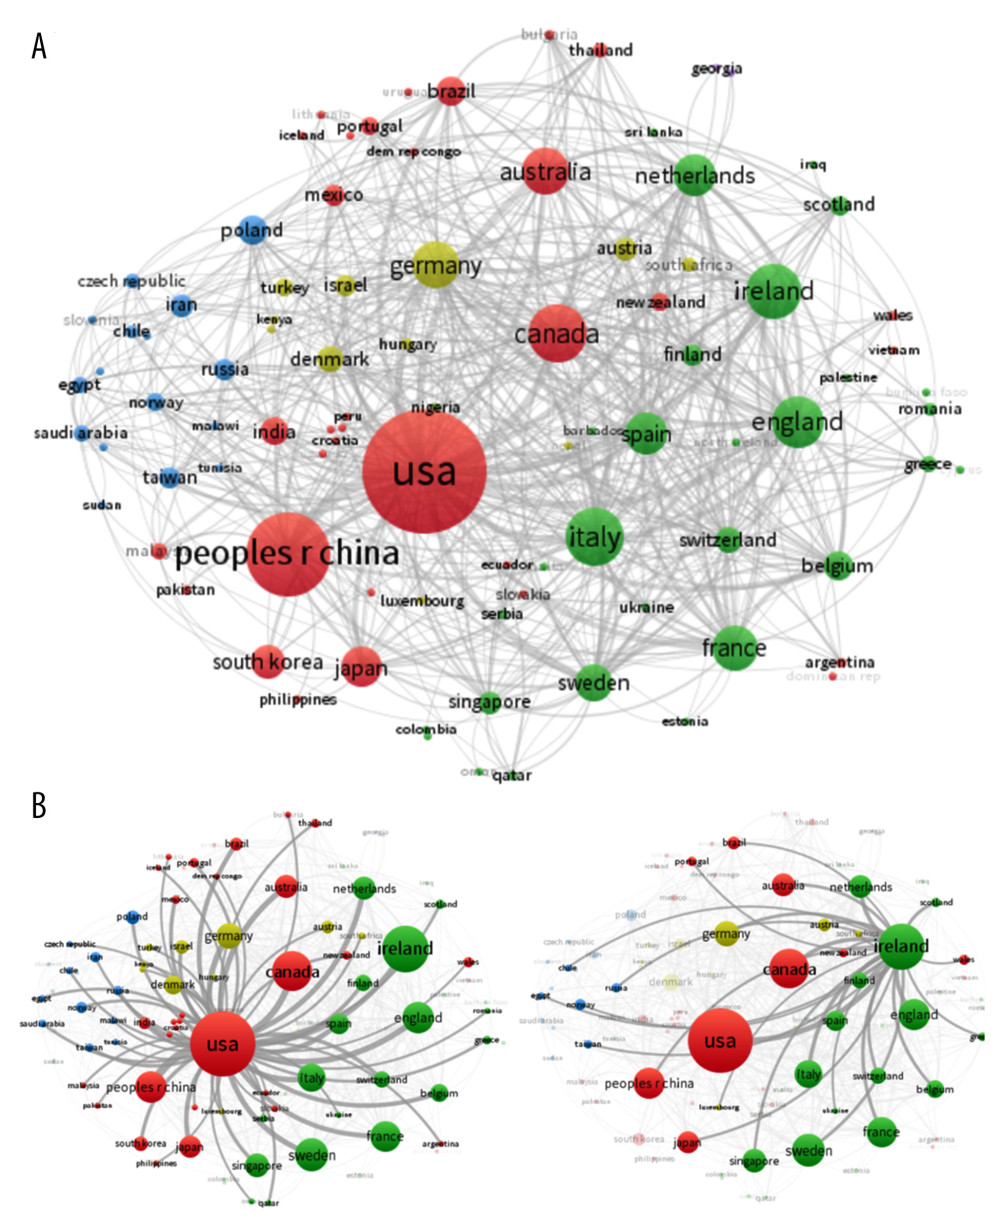
Figure 2 The documents on the microbiome-gut-brain axis (MGBA) in different countries/regions. (A) Map of the cooperation between 34 countries by the VOSviewer. (B) The cooperation between the United States and Ireland. Different colors indicate clusters of collaboration between countries, the size of the circle indicates citations to the publication, and the thickness of the line indicates the extent of collaboration. The network visualization was performed by VOSviewer (version 1.6.15; Centre for Science and Technology Studies, Leiden University, the Netherlands).